Crowded hallways in schools are not just a nuisance, they can pose serious safety risks, disrupt learning, and contribute to poor student behavior. As middle and high schools continue to grow in size, particularly in districts with larger student populations, managing traffic flow during passing periods becomes increasingly challenging. However, the right use of data, reports, and dashboards can transform hallway management from a headache into an opportunity for improvement.
In this blog post, we’ll explore how data-driven insights can empower school administrators to keep hallways safe, structured, and efficient. From analyzing patterns in student movement to making informed intervention efforts, reports and dashboards can play a vital role in managing crowded hallways in schools.
Why Crowded Hallways in Schools Matter
Crowded hallways in schools can lead to numerous challenges for both students and staff, including:
 Safety concerns
Large groups of students moving simultaneously increase the risk of accidents, bullying, littering, and unsafe behavior.
 Time lost
Students often lose valuable classroom time stuck in hallway traffic, particularly in larger schools.
 Behavioral issues
When students feel cramped or overwhelmed by crowds, they’re more likely to display negative behavior at school. Additionally, if your school hallways are always busy, it gives the impression that it is acceptable to be aimlessly wandering the halls.
 Stress on staff
Teachers and administrators may struggle to enforce rules or monitor students when the hallways are too crowded, impacting the overall school environment.
The challenge is not just about keeping hallways clear but doing so in a way that promotes safety, encourages positive student behavior, and supports the smooth operation of the school day. Data-driven solutions can help alleviate these concerns.
What the Data Actually Shows You
Knowing that your hallways are crowded is obvious. Knowing why, where, and when is what makes it solvable.
A digital hall pass system doesn’t just replace paper, it generates a real-time picture of student movement across your campus. Here’s what that data actually looks like in practice:
Hotspot reports. Which hallways, bathrooms, or entry points see the most traffic? Which are consistently congested during third period but not fifth? Hotspot data lets you reallocate staff supervision and adjust schedules based on what’s actually happening, not assumptions.
Hall pass duration reports. Who is spending 25 minutes on a pass that should take 5? Teachers and administrators can review pass duration by student, by destination, and by time of day — and spot the repeat patterns that contribute most to hallway congestion and missed class time. Minga’s Digital Hall Pass makes this visible without any manual tracking.
Overuse reports. Which teachers are issuing significantly more passes than average? Which students are requesting passes during the same period every day? These patterns often point to something worth a conversation, whether that’s a classroom dynamic issue or a student who needs additional support.
Behavior incident correlation. Data on where behavior incidents cluster gives schools the chance to intervene proactively. If a specific hallway generates a disproportionate share of incidents, you know where to direct supervision before the next incident, not after.
We recommend at least three weeks of data before drawing conclusions, but most schools start seeing actionable patterns well within that window.
If you’re at the stage of evaluating which system to use, Minga’s Digital Hall Pass Buyer’s Guide walks through exactly what to look for and the questions worth asking vendors.
Data as the Key to Smarter Hallway Crowd Management
While managing hallway traffic might seem like a logistical challenge, data can provide school administrators with a powerful tool to unlock smarter strategies. With data on hand, schools can analyze key factors like:
Peak crowding times
Identifying when and where hallways are most crowded allows administrators to adjust schedules, implement staggered passing periods, or explore other solutions.
Hotspot locations
Data can reveal which hallways, restrooms, or entry points experience the most congestion, helping schools allocate staff or resources more effectively.
Student movement patterns
Teachers and admins can use hall pass reports to see who is spending too much time in the halls or creating/assigning too many hall passes. You can review hall pass usage at any time, however, we recommend at least 3 weeks of reporting data to best identify any problem areas.
Disciplinary trends
Data on behavior incidents in overcrowded hallways provides insights into when and where problems are likely to occur, giving schools the chance to intervene proactively.
The ability to collect and analyze this data in real time can make a significant difference in managing crowded hallways in schools. But it’s not just about gathering data—it’s about making actionable decisions from that data.
Using Reports for Proactive Intervention
Reports generated from hallway and hall pass data can give schools a detailed overview of current conditions and past trends. These reports allow school administrators to make informed decisions about managing overcrowded spaces.

Tracking Trends Over Time
Reports can help schools track changes in hallway congestion over time. For example, schools might see higher traffic during specific seasons or before school events. By tracking these trends, schools can make strategic adjustments to class schedules or hallway protocols during busy periods, reducing congestion before it becomes a problem.
Identifying Problem Areas on Campus
With clear reports, schools can pinpoint specific areas of concern. Is one particular hallway or stairwell consistently overcrowded? Are certain areas more prone to behavioral incidents due to congestion? Reports can highlight these problem areas, allowing administrators to focus their efforts where they are needed most.
Behavioral Issues and Interventions
Crowded hallways don’t just create logistical problems; they create behavioral ones. Large groups of unsupervised students moving simultaneously increase the likelihood of conflicts, bullying incidents, and general disruptive behavior. When students feel cramped or overwhelmed, they’re more likely to act out. And when hallways are consistently chaotic, it signals to students that the space between classrooms is a consequence-free zone.
Connecting hallway data to your broader behavior management framework lets you move from reactive to proactive. Instead of responding to incidents after they happen, you’re identifying the conditions that produce them and addressing those directly. Schools that do this well see fewer referrals, not just tidier hallways.
Crowded hallways and tardiness are closely connected too. Students who get caught up in congestion arrive late to class, compounding both the hallway problem and the classroom disruption. If tardiness is a parallel challenge on your campus, how to reduce tardiness in high schools covers the other half of this equation.
Proactive Parent Communication
When a student is spending excessive time in the hallway or flagged for repeated pass misuse, families should be part of the conversation. Early, specific communication, not an end-of-semester phone call, gives parents the chance to address whatever is driving the behavior before it becomes a pattern. Minga’s school communication tools make it easy to loop in parents with real-time updates without adding to the administrative workload.
How Do Administrators Use Digital Hall Pass Data to Run Hall Sweeps?
A hall sweep used to mean an AP walking the building during fourth period with a clipboard, asking every student in the hall to show their pass. Most schools still run them. The clipboard approach catches students who are obviously out of place. It misses the ones who have a pass but shouldn’t.
Real-time hall data changes the workflow. An AP opens the live dashboard from their device or office and sees who is signed out right now, where each student is heading, and how long they have been gone. The sweep starts before anyone leaves the office.
Here is how it runs in practice. The dashboard shows that twelve students are out of class during fourth period. Eight are heading to the restroom. Two are at the counselor. One is at the nurse.
Once the AP is in the hall, every student they encounter can be checked against the live dashboard in seconds. Did this student have a pass? Has the pass already expired? Is the destination the same as the one they were issued? The hall sweep stops being about catching students without paper and starts being about closing gaps in the data.
The shift matters. Sweeps move from reactive to proactive. They take less time. And the data from the sweep itself feeds back into the next day’s patterns.
How Do Schools Track Class Cuts With a Digital Hall Pass System?
When the pass system knows your master bell schedule, it knows which class a student should be in at any given moment. A pass that runs past the end of a period without the student returning is not a long bathroom break. It is a class cut.
Bell Schedule Integration surfaces these automatically. An AP can pull a weekly view by student or by period and see exactly which students are out of class during which subjects. Patterns emerge fast. A student who skips Algebra II three days in a row is not having bathroom emergencies. They are avoiding a class.
This is information that lets schools intervene before a student falls far enough behind that catching up is hard. The AP, the teacher, and the counselor see the same data and can act on it the same week.
Schools that catch class cuts in week one rarely have to deal with chronic absenteeism in month three.
How Do APs Identify Frequent Flyers and Repeat Hall Pass Patterns?
The weekly hallway data review takes about twenty minutes if you know what to look for. Most APs do not have a routine for it. They should.
Three patterns are worth checking every week.
Students using the most passes. A student requesting twelve passes a week is not asking for bathroom breaks. They are avoiding instruction. Pull the destination breakdown. If it is the same destination repeatedly, talk to the student. If it is varied, talk to the counselor.
Destinations that are overloaded. If the second-floor bathroom shows three students at once during fourth period every day, the system is telling you something the staff already half-knows. Adjust the capacity setting or run a sweep at that location at that time. The destination data points exactly where to put your attention.
Teachers whose pass-issuance volume is significantly higher or lower than that of their peers. A teacher issuing four times as many passes as their colleagues in the same grade may be running a classroom culture that lets students leave whenever they want. A teacher issuing zero passes may be telling students to leave without using the system at all. Both are worth a conversation.
None of these patterns are visible without data. All of them are visible within the first two weeks if someone is looking.
Dashboards: Real-Time Data for Immediate Action
Dashboards take hallway management to the next level by offering real-time data on school traffic. These tools provide administrators with a visual snapshot of current hallway conditions, allowing them to respond to problems as they arise.

Visualizing Traffic Flow
A well-designed dashboard can show which areas of the school are experiencing the most traffic at any given moment. By visualizing traffic flow, administrators can quickly identify bottlenecks and take immediate action. This might involve sending a staff member to a crowded hallway, adjusting the timing of bell schedules, or encouraging students to use alternative routes.
Monitoring Behavior in Real Time
In addition to tracking hallway traffic, dashboards can also monitor behavioral incidents. This helps administrators keep a close eye on trouble spots and intervene before issues arise. Dashboards that show both traffic and behavior data offer a comprehensive view of what’s happening in the school at any moment, empowering staff to take action when needed.
How Do Time-Overdue Alerts and Meetup Detection Work in Hall Pass Systems?
Two features address the gaps that volume data alone cannot catch.
Time-overdue alerts. When a pass runs past its duration without the student returning, the system flags it. The AP sees which student is overdue and by how long. This turns a passive dashboard into an active notification.
Most digital hall pass systems tell you where a student is going. A well-built one tells you who else is going there at the same time, and stops them before they get there.
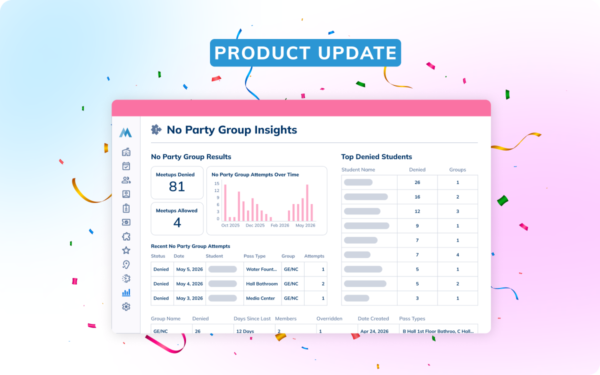
Here is how meetup detection, aka “No Party Groups” works in practice. An AP notices from pass data that the same three students are regularly signing out to the second-floor bathroom during third period. They add those students to a No Party Group. From that point, when any one member of the group has an active hall pass, the system automatically blocks the other members from creating or receiving a pass at the same time. The meetup doesn’t happen. No staff intervention required.
The feature is used most commonly for vaping, vandalism, bullying, and, as Andrew Lambo, assistant principal at Danbury High School, put it, “We noticed a group gathering in the bathrooms, so we added them to the No Party Group. The system stops them for us, no extra work needed.”
A few details worth knowing for implementation. Students can be added to a No Party Group individually, by grade, by existing group, or via CSV upload. If a student is a member of two different No Party Groups, they will be blocked if any member from either group is currently in the hall. Staff can override a block in an emergency. And groups can be set to inactive rather than deleted if the restriction may be needed again later.
Improving Scheduling with Data-Driven Decisions
One of the most effective ways to manage crowded hallways is through strategic scheduling, and data plays a critical role in this process. By analyzing when and where hallway congestion occurs, schools can make informed decisions about class schedules, staggered passing periods, and even lunch breaks.
Optimizing Passing Periods
By using data to analyze traffic patterns, schools can determine the optimal length for passing periods. Shorter passing periods may help reduce downtime, but they can also contribute to overcrowding. Longer passing periods may allow for smoother transitions but can take time away from instruction. By studying hallway traffic data, schools can find the right balance that keeps hallways manageable without sacrificing learning time.
Staggering Release Times/Passing Periods
For particularly crowded schools, staggered release times can be a game-changer. By releasing different groups of students at slightly different times, schools can reduce the number of students in the hallways at any given moment. Data from dashboards and reports can help identify the best times to stagger releases, ensuring that no group is consistently disadvantaged.
Students stuck in hallway congestion during passing periods aren’t just tardy; they’re missing instructional time that compounds over the semester. Every minute spent navigating a crowded corridor is a minute not spent in class. For schools already dealing with tardiness issues, crowded passing periods make the problem significantly worse. A tardy management system that connects to hall pass data closes this loop: administrators can see whether a late arrival came from a long pass or from a congested hallway and respond accordingly.
The Benefits of Data-Driven Hallway Crowd Management
Using data, reports, and dashboards to manage crowded hallways in schools offers numerous benefits for schools:
 Enhanced safety
By monitoring and managing hallway traffic, schools can reduce the risk of accidents and incidents, creating a safer environment for students and staff.
 Improved behavior
When students aren’t frustrated by overcrowded spaces, they are less likely to act out, leading to fewer disciplinary problems.
 Increased efficiency
By optimizing passing periods and reducing hallway congestion, schools can ensure that students spend more time in class and less time navigating crowded hallways.
 Better resource allocation
With data-driven insights, schools can deploy staff where they are most needed, reducing the strain on administrators and teachers.
Managing crowded hallways is no easy task, but with the right data, reports, and dashboards, it becomes a manageable and even solvable problem. By using real-time data to track student movement, identify problem areas, and monitor behavior, schools can take proactive steps to ensure that hallways remain safe, efficient, and stress-free for everyone.
Ready to Strengthen Student Engagement Across Your School?
Book a demo today and start building a more connected school community.